Fibotin από Tapio Salo
visualize the fibonacci retracement levels
4 χρήστες4 χρήστες
Μεταδεδομένα επέκτασης
Στιγμιότυπα
Σχετικά με την επέκταση
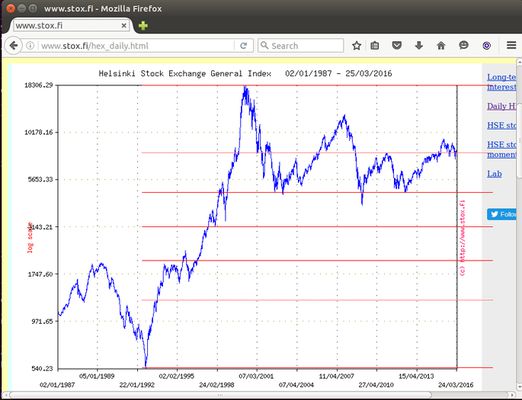
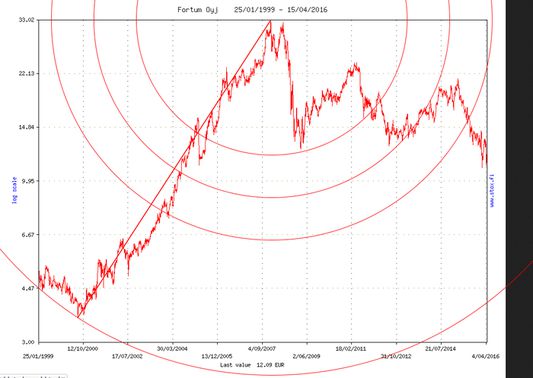
Fibotin is a plotting tool for illustrating the fibonacci retracement level graphically from the stock chart images found from pages related to stock markets. With this tool user can set fibonacci retracement levels on the image in the web page and quickly see if the the price action is close to any desired retracement levels.
For background information see articles about technical analysis for stock markets.
http://stockcharts.com/school/doku.php?id=chart_school:chart_analysis:fibonacci_retracemen
For background information see articles about technical analysis for stock markets.
http://stockcharts.com/school/doku.php?id=chart_school:chart_analysis:fibonacci_retracemen
Βαθμολογήθηκε με 2 από έναν αξιολογητή
Περισσότερες πληροφορίες
- Έκδοση
- 3.1resigned1
- Μέγεθος
- 16,21 KB
- Τελευταία ενημέρωση
- 2 χρόνια πριν (25 Απρ 2024)
- Άδεια
- Άδεια MIT
- Ιστορικό εκδόσεων
- Προσθήκη σε συλλογή