Fibotin 作者: Tapio Salo
visualize the fibonacci retracement levels
5 位使用者5 位使用者
擴充套件後設資料
畫面擷圖
關於此擴充套件
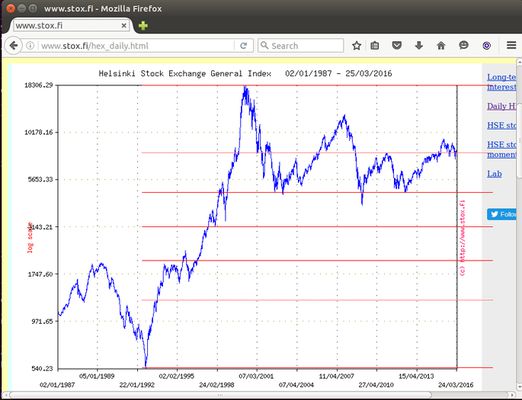
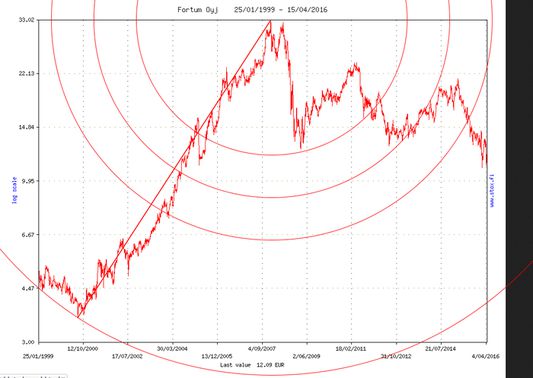
Fibotin is a plotting tool for illustrating the fibonacci retracement level graphically from the stock chart images found from pages related to stock markets. With this tool user can set fibonacci retracement levels on the image in the web page and quickly see if the the price action is close to any desired retracement levels.
For background information see articles about technical analysis for stock markets.
http://stockcharts.com/school/doku.php?id=chart_school:chart_analysis:fibonacci_retracemen
For background information see articles about technical analysis for stock markets.
http://stockcharts.com/school/doku.php?id=chart_school:chart_analysis:fibonacci_retracemen
由 1 位評論者給出 2 分
更多資訊
- 版本
- 3.1resigned1
- 大小
- 16.21 KB
- 最近更新
- 2 年前 (2024年4月25日)
- 授權條款
- MIT License
- 版本紀錄
- 新增至收藏集