Fibotin од Tapio Salo
visualize the fibonacci retracement levels
1 корисник1 корисник
Метаподаци додатка
Снимци екрана
О овом додатку
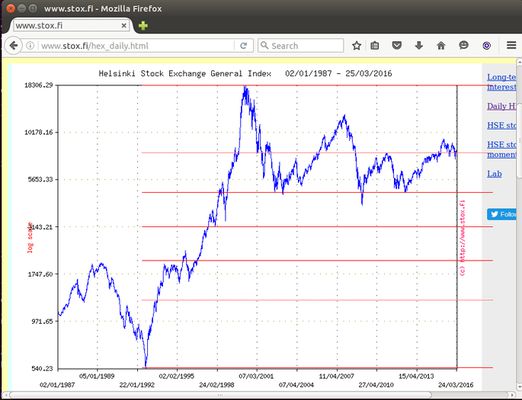
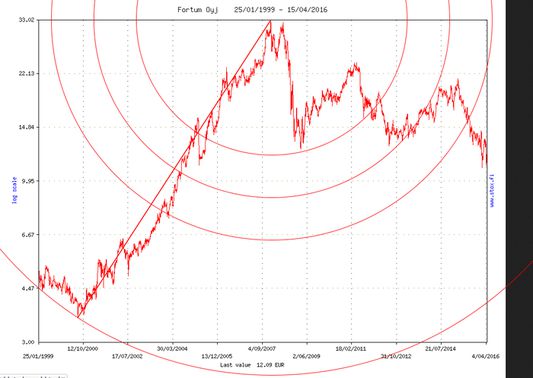
Fibotin is a plotting tool for illustrating the fibonacci retracement level graphically from the stock chart images found from pages related to stock markets. With this tool user can set fibonacci retracement levels on the image in the web page and quickly see if the the price action is close to any desired retracement levels.
For background information see articles about technical analysis for stock markets.
http://stockcharts.com/school/doku.php?id=chart_school:chart_analysis:fibonacci_retracemen
For background information see articles about technical analysis for stock markets.
http://stockcharts.com/school/doku.php?id=chart_school:chart_analysis:fibonacci_retracemen
Оцењено са 2 од стране 1 рецензента
Више информација
- Везе додатка
- Издање
- 3.1resigned1
- Величина
- 16,21 KB
- Последњи пут ажурирано
- pre 2 godine (25. apr. 2024.)
- Дозвола
- MIT дозвола
- Историјат издања
- Додај у збирку