Fibotin nga Tapio Salo
visualize the fibonacci retracement levels
Që të përdorni këtë zgjerim, ju duhet Firefox-i
Tejtëdhëna Zgjerimi
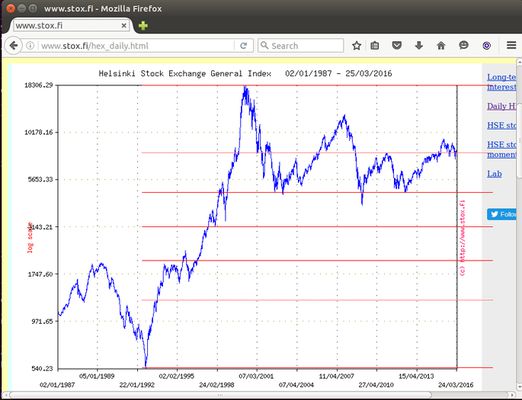
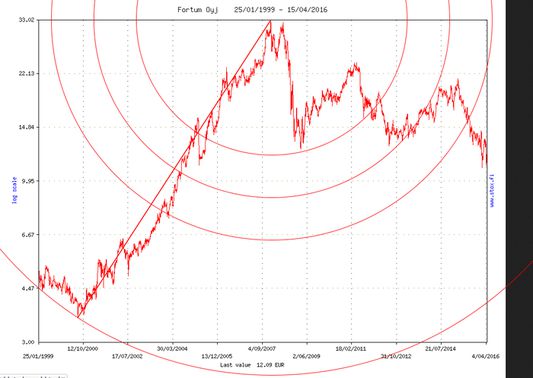
Foto ekrani
Rreth këtij zgjerimi
Fibotin is a plotting tool for illustrating the fibonacci retracement level graphically from the stock chart images found from pages related to stock markets. With this tool user can set fibonacci retracement levels on the image in the web page and quickly see if the the price action is close to any desired retracement levels.
For background information see articles about technical analysis for stock markets.
http://stockcharts.com/school/doku.php?id=chart_school:chart_analysis:fibonacci_retracemen
For background information see articles about technical analysis for stock markets.
http://stockcharts.com/school/doku.php?id=chart_school:chart_analysis:fibonacci_retracemen
Vlerësoni rastin tuaj
Më tepër të dhëna
- Version
- 3.1resigned1
- Madhësi
- 16,21 KB
- Përditësuar së fundi më
- 2 muaj më parë (25 Pri 2024)
- Kategori të Afërta
- Licencë
- The MIT License
- Historik Versionesh
Shtojeni në koleksion
Më tepër zgjerime nga Tapio Salo
 Ende pa vlerësime
- Ende pa vlerësime
- Ende pa vlerësime
- Ende pa vlerësime
- Ende pa vlerësime
- Ende pa vlerësime