Fibotin 제작자: Tapio Salo
visualize the fibonacci retracement levels
이 확장 기능을 사용하려면 Firefox가 필요함
확장 메타 데이터
스크린샷
정보
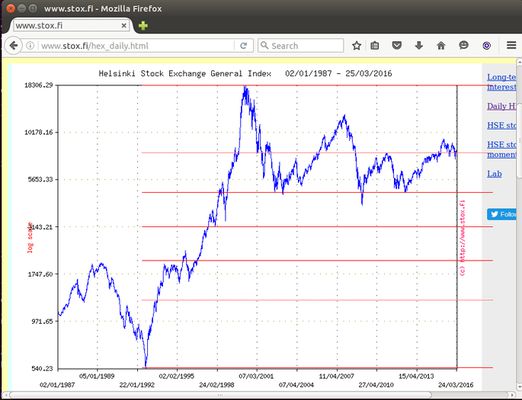
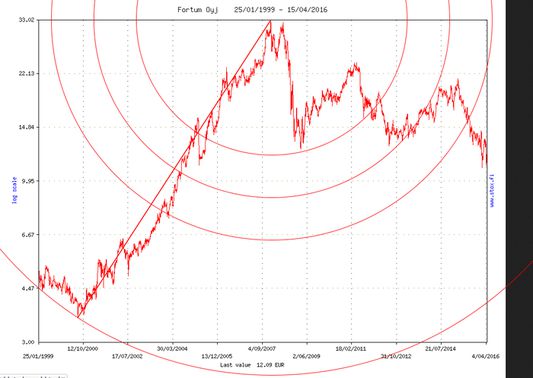
Fibotin is a plotting tool for illustrating the fibonacci retracement level graphically from the stock chart images found from pages related to stock markets. With this tool user can set fibonacci retracement levels on the image in the web page and quickly see if the the price action is close to any desired retracement levels.
For background information see articles about technical analysis for stock markets.
http://stockcharts.com/school/doku.php?id=chart_school:chart_analysis:fibonacci_retracemen
For background information see articles about technical analysis for stock markets.
http://stockcharts.com/school/doku.php?id=chart_school:chart_analysis:fibonacci_retracemen
평가
추가 정보
모음집에 추가
Tapio Salo 님의 다른 확장 기능
 아직 평점이 없습니다
- 아직 평점이 없습니다
- 아직 평점이 없습니다
- 아직 평점이 없습니다
- 아직 평점이 없습니다
- 아직 평점이 없습니다