TradingLever - Stock Analysis per Leverium Team
TradingLever connects to your current browser window to pull stock market symbols you’re viewing. It provides a full dashboard for analysis and comparison between the companies in the list.
1 Usator1 Usator
Metadatos del extension
Capturas de schermo


A proposito de iste extension
TradingLever connects to your current browser window to pull stock market symbols you’re viewing and provides a full dashboard for analysis and comparison between the companies in the list.
Use cases:
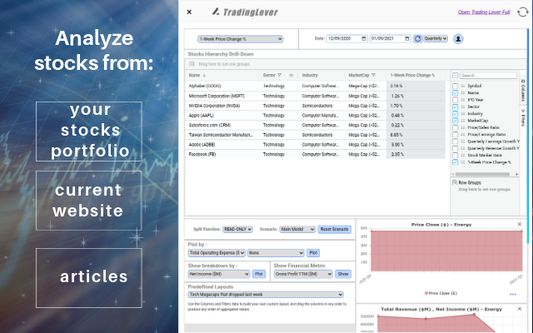
Load stocks list from a news article you’re reading and analyze them.
Load from a list of “trending” symbols and analyze them.
Load list from your personal portfolio (e.g. from your trading website) and analyze/compare them.
Load from any other custom list you’re tracking and analyze the companies in the list.
How it works:
On loading the extension, the list on the left pane is filled with company symbols extracted from the current website. On the second column we see a financial metric - by default this is "1-Week Price Change %". It is possible to sort the list by this column by clicking on the column name, or change this column to any other property, using the listbox above. Properties include EPS, EBIT, price/revenue growth rates, financial ratios, and more. It is also possible to add more columns by clicking on the "Columns" Tab on the right, and either clicking the checkbox or dragging columns into the table.
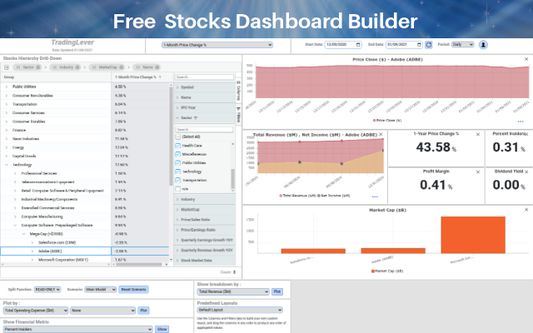
Stocks dashboard:
On clicking a symbol/name in the left pane, the whole dashboard will be refreshed to show the income/profit, price chart, and financial metrics for the selected item. Also, a comparison of all list items by market cap will be shown in a barchart at the bottom.
Custom plots:
The default view can easily be customized by clicking the "expand" icon below the list and adding more plots. It is possible to add two types of plots:
1. Time-series plots - show the property as a function of time: e.g. show gross profit, or operating income, or any other metric shown in the financial statement, as a function of time.
2. Breakdown plots - select an inherent property such as PE, 1-year price change, dividend yield, and more - and show a comparison breakdown chart of this property for all entries in the list. This is similar to the "market cap" breakdown which is shown by default at the bottom.
Drag-and-drop customization:
All elements on the dashboard can be easily dragged and resized to make the dashboard easier to use and highlight the specific financial properties that the user is interested in.
Adding companies to list:
It is possible to use the searchbox at the top of the page to add more companies to compare. Just type in a symbol or a company name and click the checkbox.
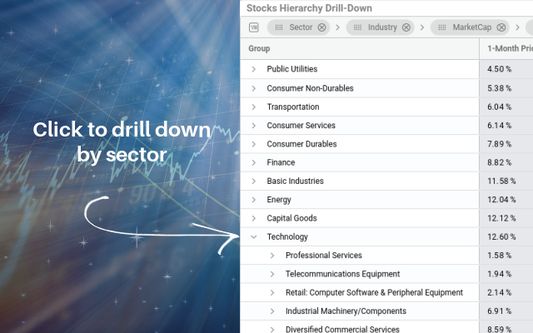
Grouping and aggregating items:
It is possible to group certain companies together and view their metrics as an aggregate. E.g. compare Energy companies to Finance companies or Technology companies. To do this, drag the relevant column from the Columns tab on the right into the aggregation space just above the list. For example, drag the Market Cap column into the aggregation space to see a breakdown of the selected companies by market cap. It is possible to drag several columns to see several levels of aggregation. It is then possible to view certain company metrics such as price changes, revenues, EPS and more on an aggregate level - to compare the financial metric of the company to the metric on the aggregate level of the group. For example, to see if an energy stock or technology stock's PE ratio is high or low compared to its group. Or to compare the price/sales ratio of a tech symbol to the average price/sales ratio of the whole technology sector. It is also possible to refine the "group" definition to compare only to specific market caps, financial ratio groups, IPO years, etc. This makes our comparison more accurate. This method is more accurate than comparing the price change to the change of the S&P index, or to the Dow Jones Industrial Average. These are both very general indices and less specific to a specific industry/sector/market cap group.
Intended audience:
This app is geared towards anyone interested in investing in the NYSE or Nasdaq. It is geared both towards professional investors as well as beginning ones, doing their first steps in researching the US equities markets. We hope we've simplified the user interface enough that anyone can use it, and are open to any sugestions for improvement!
Data updates:
Data is updated daily for the close price and financials (financial ratios, and all data from the financial statement) of the previous trading day (1-day lag). This platform is less suitable to day-trading or real-time trading.
App permissions:
The app will read the list from the current website you're surfing upon clicking the app icon in the toolbar. No other information will be read or changed in the website. The list will be sent to our servers solely for the purpose of retrieving the financial data for the companies in the list.
Cost:
This app is provided 100% free of charge, as a demonstration of the Leverium financial analytics platform. Leverium can be used for other purposes that are not free, but we have decided to provide the TradingLever extension for free to the investing community.
Disclaimer:
The data provided is not investment advice, and the creators of TradingLever take no responsibility for the accuracy of the data, or any actions that may be done as a result of viewing this data, including but not limited to investment decisions, loss of money, and any other damage that come as a result of using TradingLever. If there are any problems with the data provided, we’d appreciate your feedback at tradinglever@leverium.com so we can quickly correct it.
Use cases:
Load stocks list from a news article you’re reading and analyze them.
Load from a list of “trending” symbols and analyze them.
Load list from your personal portfolio (e.g. from your trading website) and analyze/compare them.
Load from any other custom list you’re tracking and analyze the companies in the list.
How it works:
On loading the extension, the list on the left pane is filled with company symbols extracted from the current website. On the second column we see a financial metric - by default this is "1-Week Price Change %". It is possible to sort the list by this column by clicking on the column name, or change this column to any other property, using the listbox above. Properties include EPS, EBIT, price/revenue growth rates, financial ratios, and more. It is also possible to add more columns by clicking on the "Columns" Tab on the right, and either clicking the checkbox or dragging columns into the table.
Stocks dashboard:
On clicking a symbol/name in the left pane, the whole dashboard will be refreshed to show the income/profit, price chart, and financial metrics for the selected item. Also, a comparison of all list items by market cap will be shown in a barchart at the bottom.
Custom plots:
The default view can easily be customized by clicking the "expand" icon below the list and adding more plots. It is possible to add two types of plots:
1. Time-series plots - show the property as a function of time: e.g. show gross profit, or operating income, or any other metric shown in the financial statement, as a function of time.
2. Breakdown plots - select an inherent property such as PE, 1-year price change, dividend yield, and more - and show a comparison breakdown chart of this property for all entries in the list. This is similar to the "market cap" breakdown which is shown by default at the bottom.
Drag-and-drop customization:
All elements on the dashboard can be easily dragged and resized to make the dashboard easier to use and highlight the specific financial properties that the user is interested in.
Adding companies to list:
It is possible to use the searchbox at the top of the page to add more companies to compare. Just type in a symbol or a company name and click the checkbox.
Grouping and aggregating items:
It is possible to group certain companies together and view their metrics as an aggregate. E.g. compare Energy companies to Finance companies or Technology companies. To do this, drag the relevant column from the Columns tab on the right into the aggregation space just above the list. For example, drag the Market Cap column into the aggregation space to see a breakdown of the selected companies by market cap. It is possible to drag several columns to see several levels of aggregation. It is then possible to view certain company metrics such as price changes, revenues, EPS and more on an aggregate level - to compare the financial metric of the company to the metric on the aggregate level of the group. For example, to see if an energy stock or technology stock's PE ratio is high or low compared to its group. Or to compare the price/sales ratio of a tech symbol to the average price/sales ratio of the whole technology sector. It is also possible to refine the "group" definition to compare only to specific market caps, financial ratio groups, IPO years, etc. This makes our comparison more accurate. This method is more accurate than comparing the price change to the change of the S&P index, or to the Dow Jones Industrial Average. These are both very general indices and less specific to a specific industry/sector/market cap group.
Intended audience:
This app is geared towards anyone interested in investing in the NYSE or Nasdaq. It is geared both towards professional investors as well as beginning ones, doing their first steps in researching the US equities markets. We hope we've simplified the user interface enough that anyone can use it, and are open to any sugestions for improvement!
Data updates:
Data is updated daily for the close price and financials (financial ratios, and all data from the financial statement) of the previous trading day (1-day lag). This platform is less suitable to day-trading or real-time trading.
App permissions:
The app will read the list from the current website you're surfing upon clicking the app icon in the toolbar. No other information will be read or changed in the website. The list will be sent to our servers solely for the purpose of retrieving the financial data for the companies in the list.
Cost:
This app is provided 100% free of charge, as a demonstration of the Leverium financial analytics platform. Leverium can be used for other purposes that are not free, but we have decided to provide the TradingLever extension for free to the investing community.
Disclaimer:
The data provided is not investment advice, and the creators of TradingLever take no responsibility for the accuracy of the data, or any actions that may be done as a result of viewing this data, including but not limited to investment decisions, loss of money, and any other damage that come as a result of using TradingLever. If there are any problems with the data provided, we’d appreciate your feedback at tradinglever@leverium.com so we can quickly correct it.
Valutate 0 per 0 revisores
Plus de informationes
- Ligamines del additivo
- Version
- 1.0.1.1
- Dimension
- 22,06 KB
- Ultime actualisation
- 5 år siden (14. feb. 2021)
- Categorias associate
- Licentia
- Tote le derectos es reservate
- Politica de confidentialitate
- Lege le politica de confidentialitate pro iste additivo
- Historia de versiones
- Adder al collection
This extension is still a work in progress,, and any suggestions for improvement, bug reports, etc are welcome.