Fibotin Tapio Salo طوّرها
visualize the fibonacci retracement levels
You'll need Firefox to use this extension
بيانات الامتداد الوصفية
لقطات الشاشة
عن الامتداد هذا
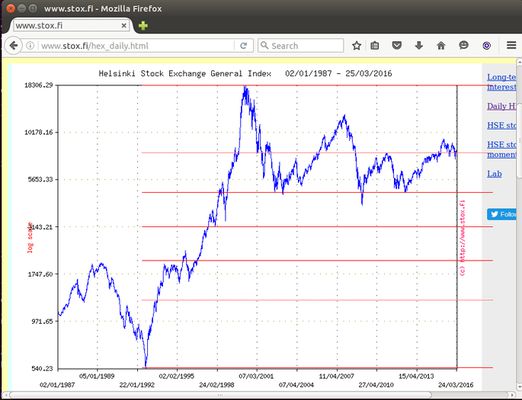
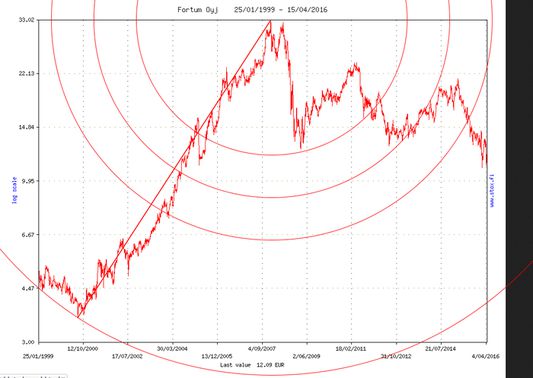
Fibotin is a plotting tool for illustrating the fibonacci retracement level graphically from the stock chart images found from pages related to stock markets. With this tool user can set fibonacci retracement levels on the image in the web page and quickly see if the the price action is close to any desired retracement levels.
For background information see articles about technical analysis for stock markets.
http://stockcharts.com/school/doku.php?id=chart_school:chart_analysis:fibonacci_retracemen
For background information see articles about technical analysis for stock markets.
http://stockcharts.com/school/doku.php?id=chart_school:chart_analysis:fibonacci_retracemen
قيّم تجربتك
معلومات أكثر
- الإصدارة
- 3.1resigned1
- الحجم
- ١٦٫٢١ KB
- آخر تحديث
- منذ شهرين (٢٥ أبريل ٢٠٢٤)
- Related Categories
- الرخصة
- The MIT License
- تأريخ الإصدار
أضِف إلى مجموعة
امتدادات أخرى من Tapio Salo
 لا تقييمات بعد
- لا تقييمات بعد
- لا تقييمات بعد
- لا تقييمات بعد
- لا تقييمات بعد
- لا تقييمات بعد